2918 S 7th St, Tacoma, WA
Offered at $649,000 | MLS #2498906
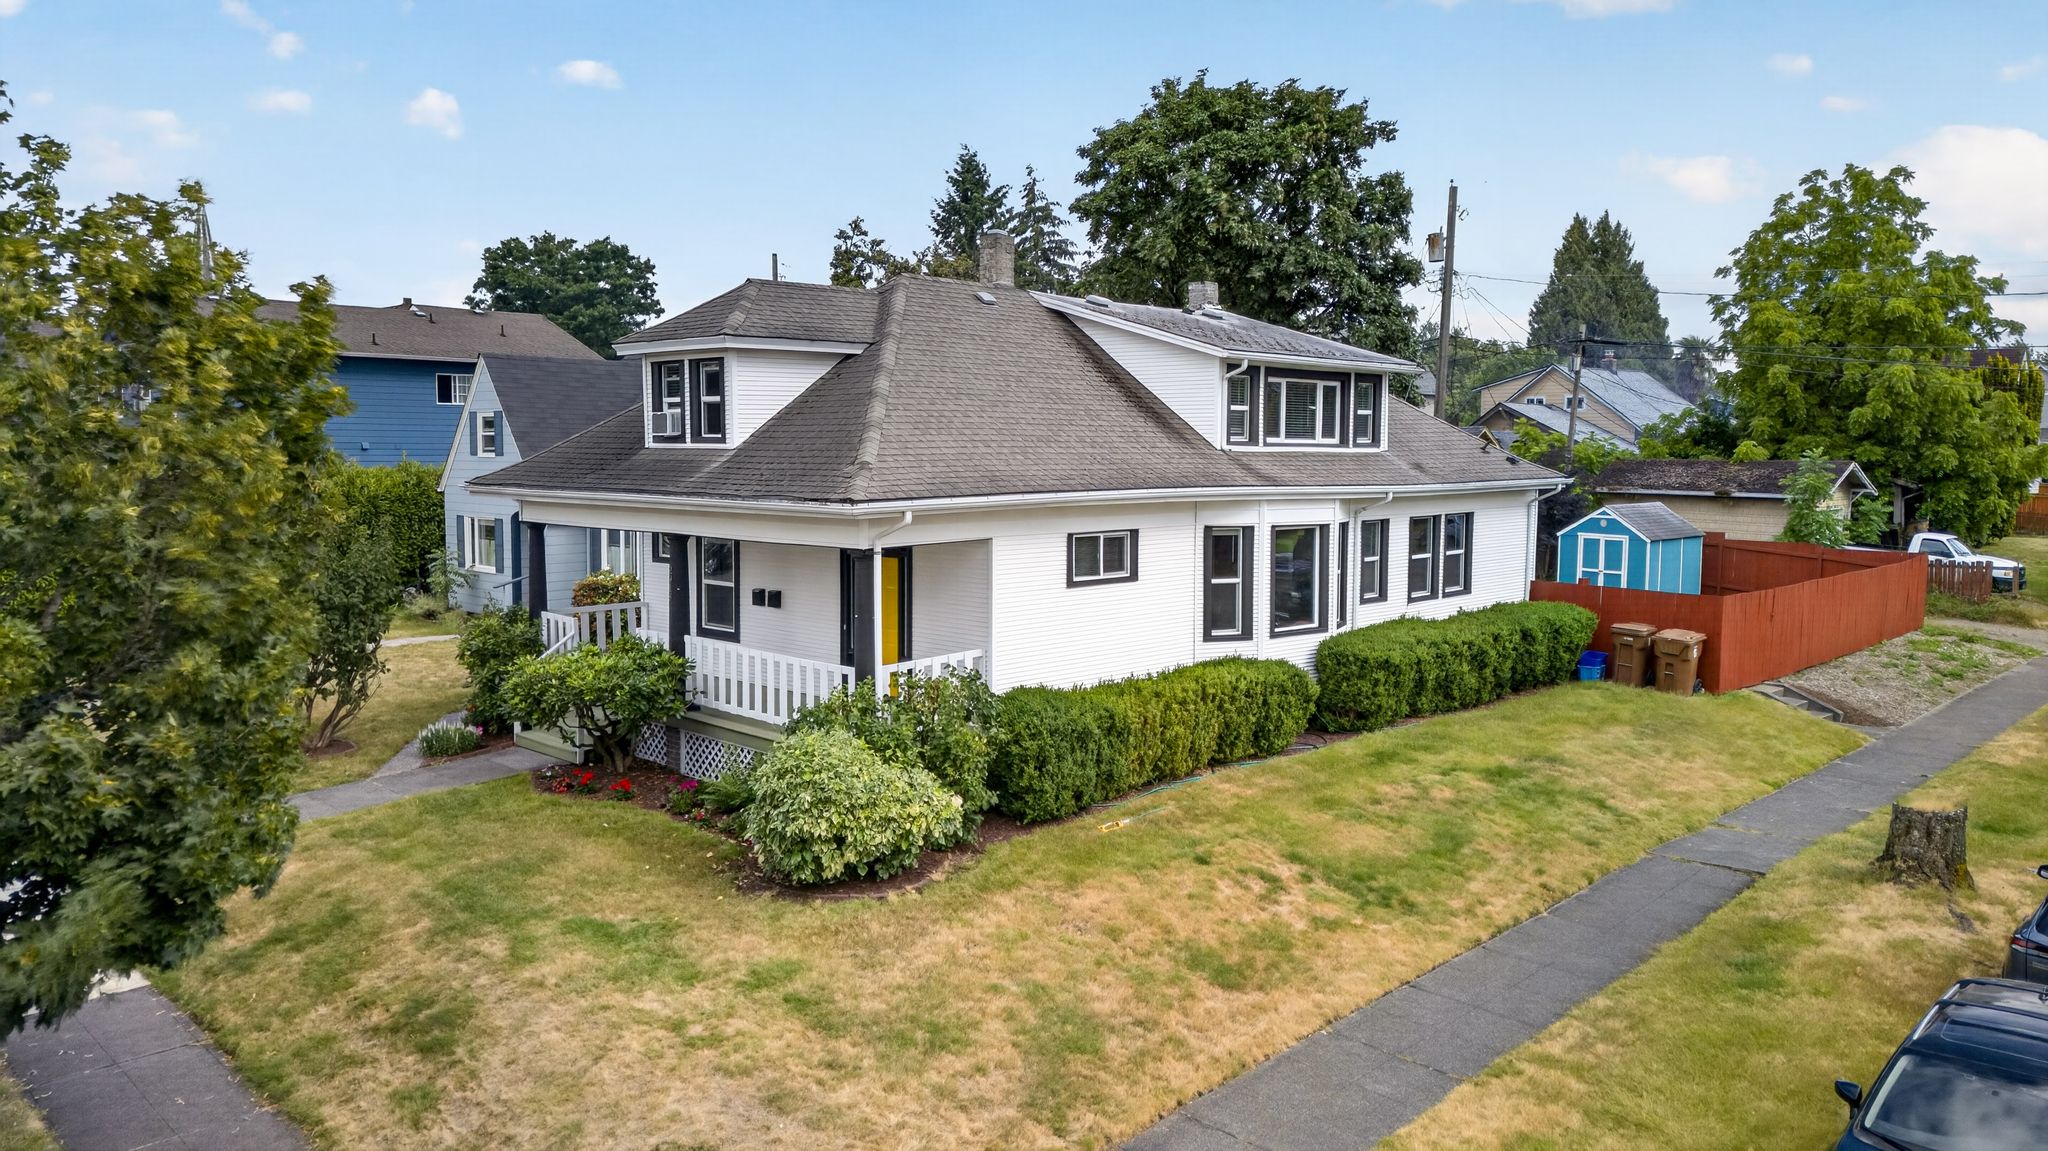
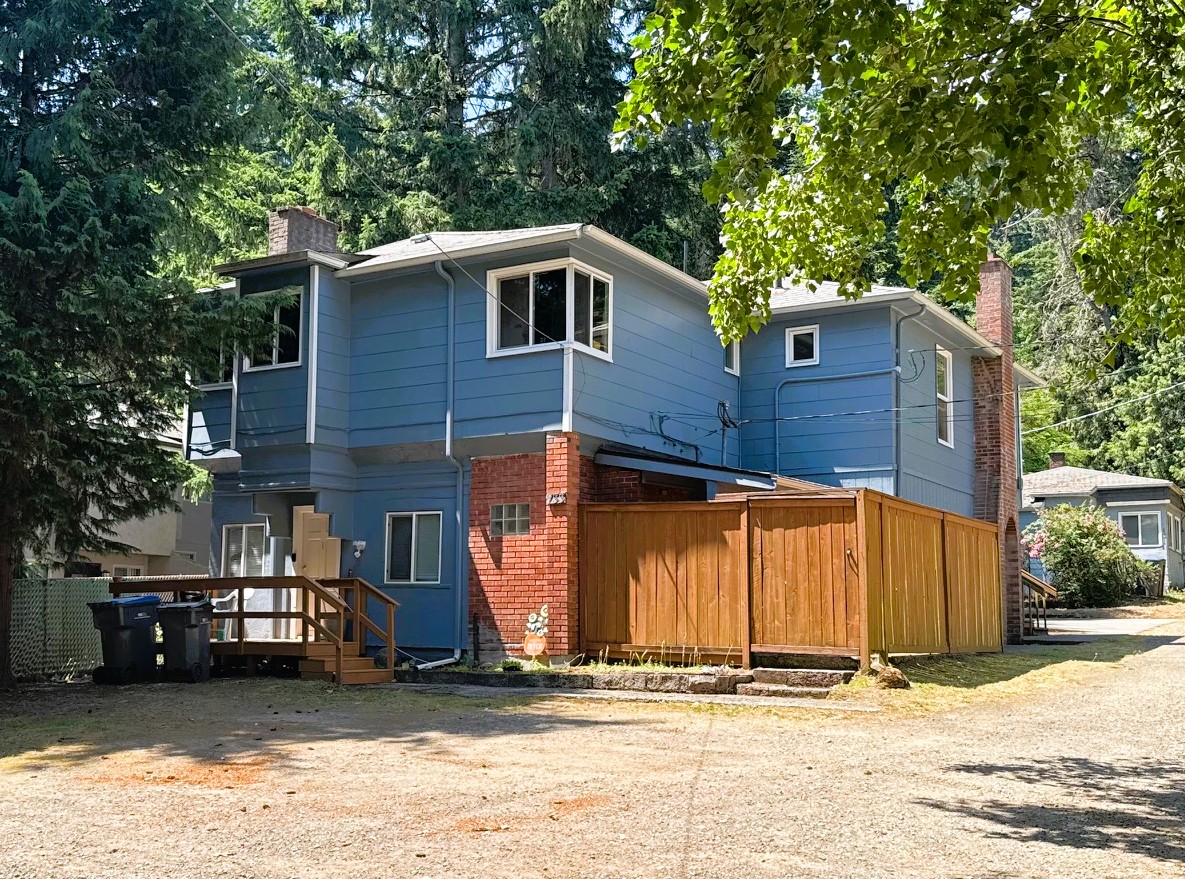
If you've been searching for a Tacoma duplex for sale in one of the city's most desirable neighborhoods, this newly listed property offers an exceptional opportunity for both owner-occupants and investors.
Located just one block from Tacoma's popular 6th Avenue District, this beautifully maintained legal duplex combines strong investment potential with an unbeatable walkable location. Restaurants, coffee shops, breweries, shopping, and nightlife are all just steps from your front door.
A Rare Opportunity for Owner-Occupants & Investors
Unlike many multifamily properties currently on the market, both units are vacant and professionally staged. That means buyers can move in immediately or lease both units at today's market rents while selecting their own tenants from day one.
The property features:
- Price: $649,000
- Units: 2
- MLS #: 2498906
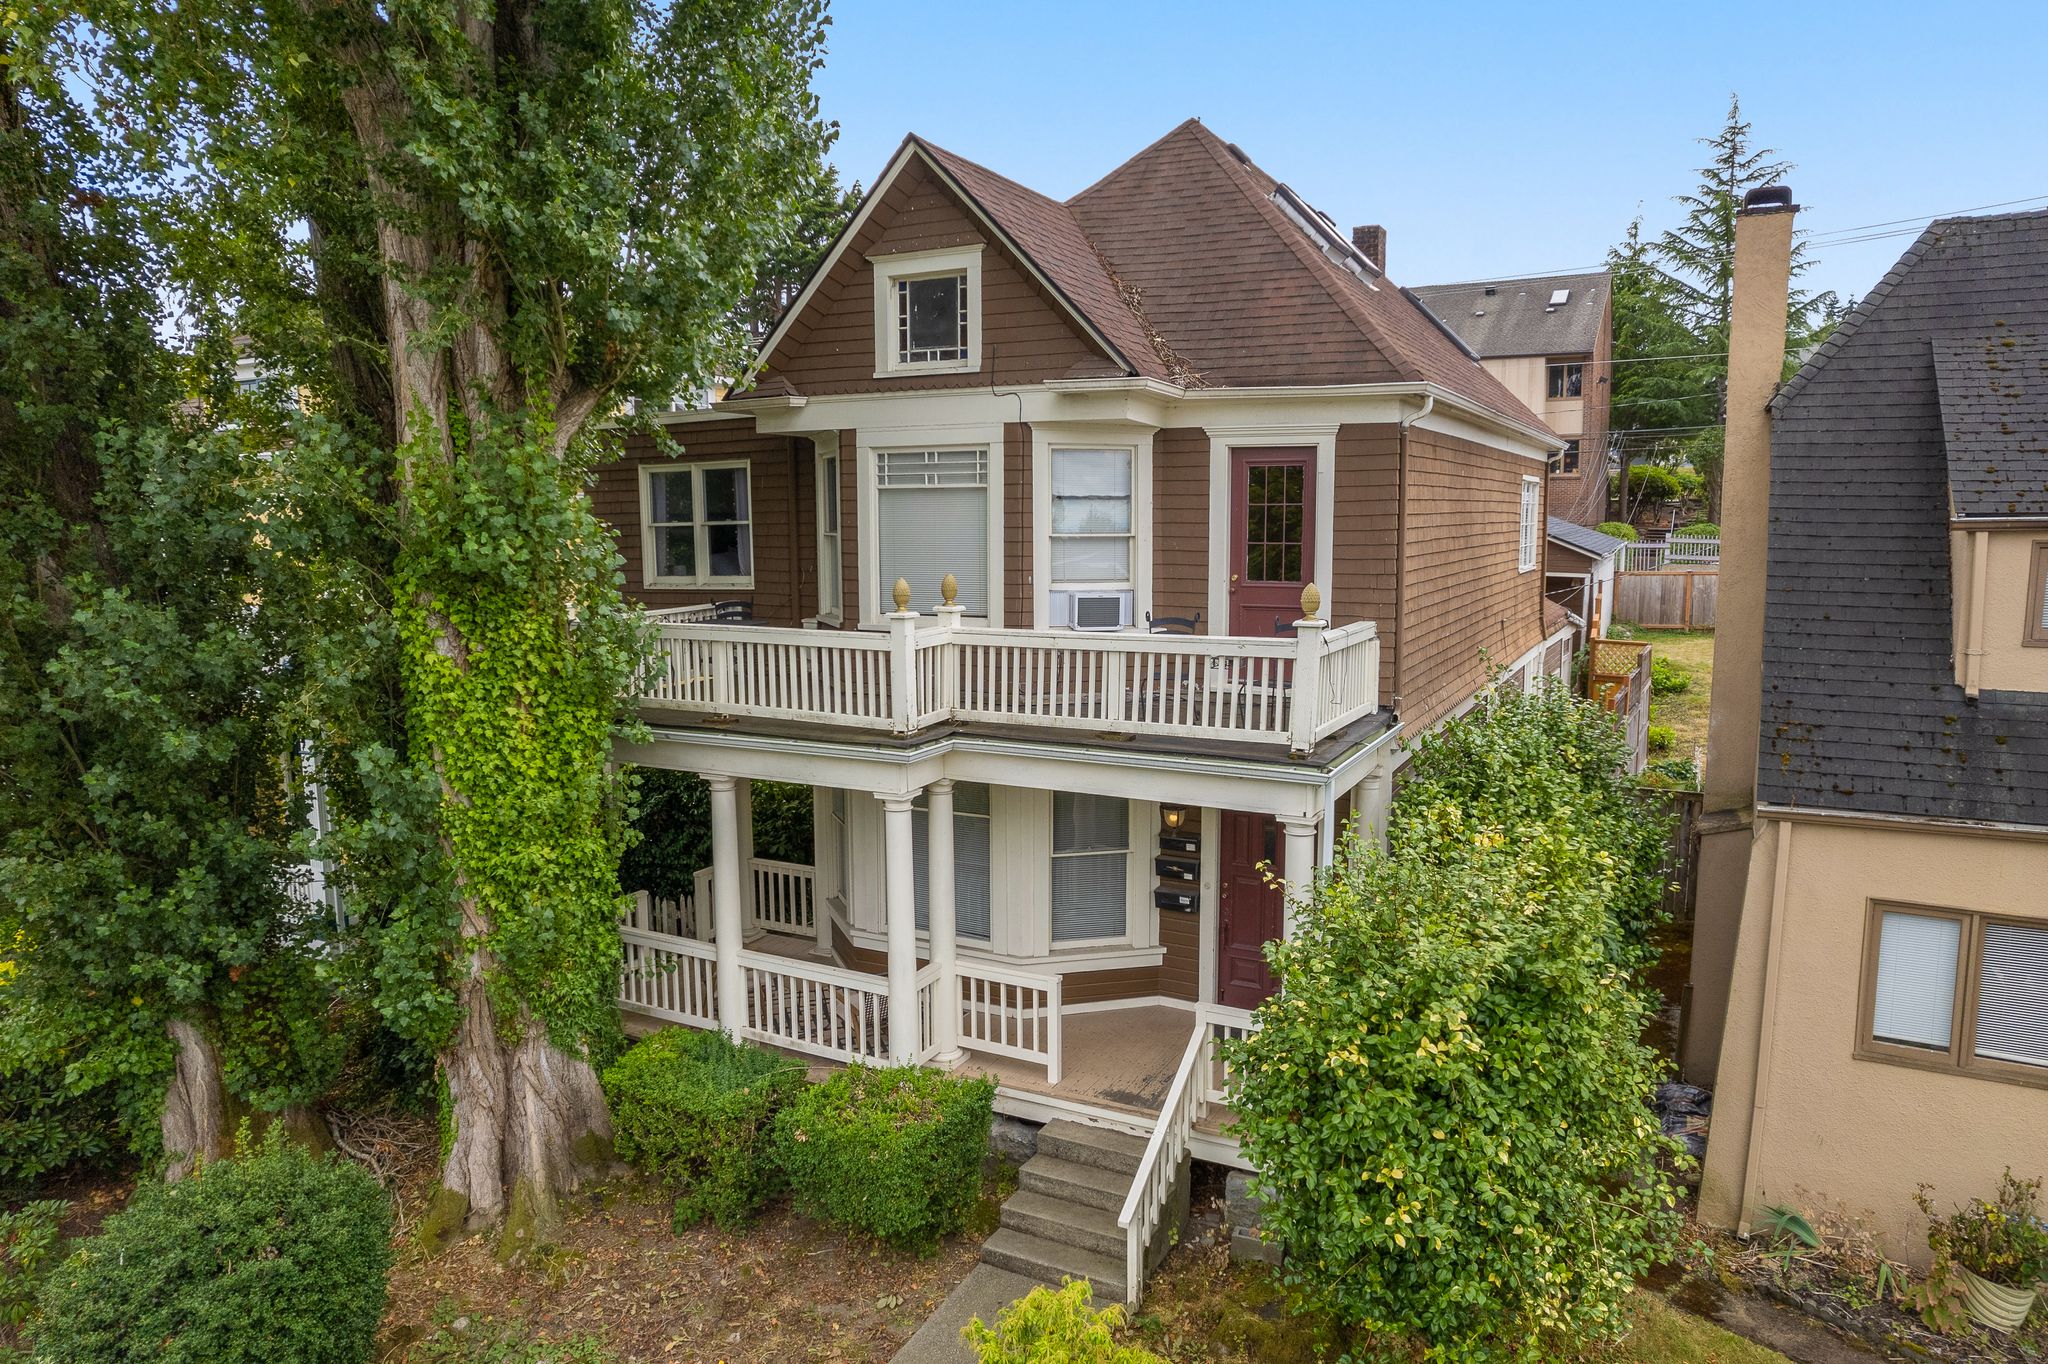
- Spacious 1,400 SF main-floor unit with 3 bedrooms and 1.5 bathrooms
- Upper 648 SF unit with 1 bedroom and 1 bathroom
- Updated plumbing and electrical
- Newer electrical panels
- Newer windows throughout
- Roof less than 10 years old
- Mature landscaping and outstanding curb appeal
- Welcoming covered front porch
The main-level residence lives much like a single-family home while providing the added benefit of rental income from the second unit—a combination that continues to be highly sought after in today's market.
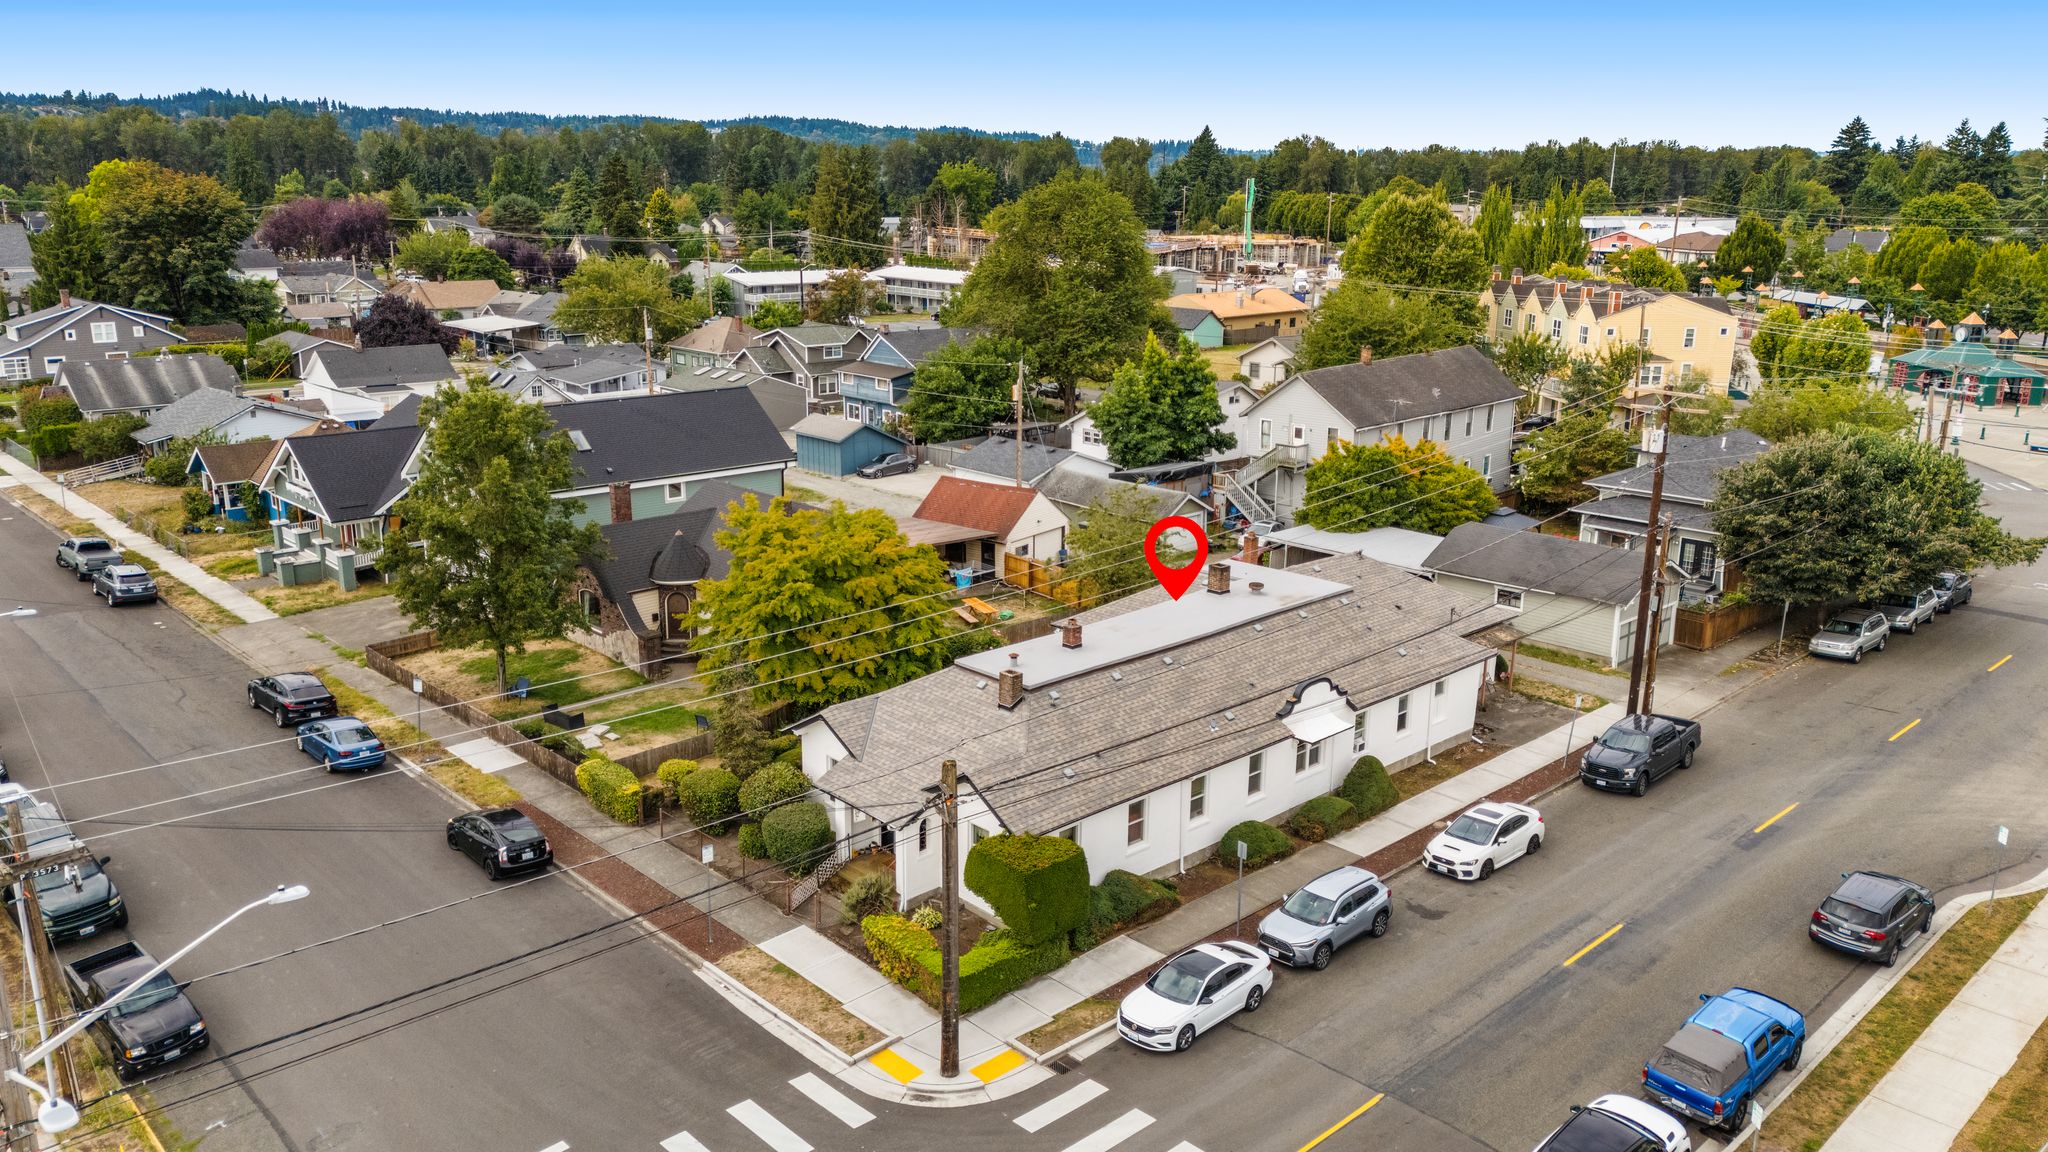
Zoned for Future Flexibility
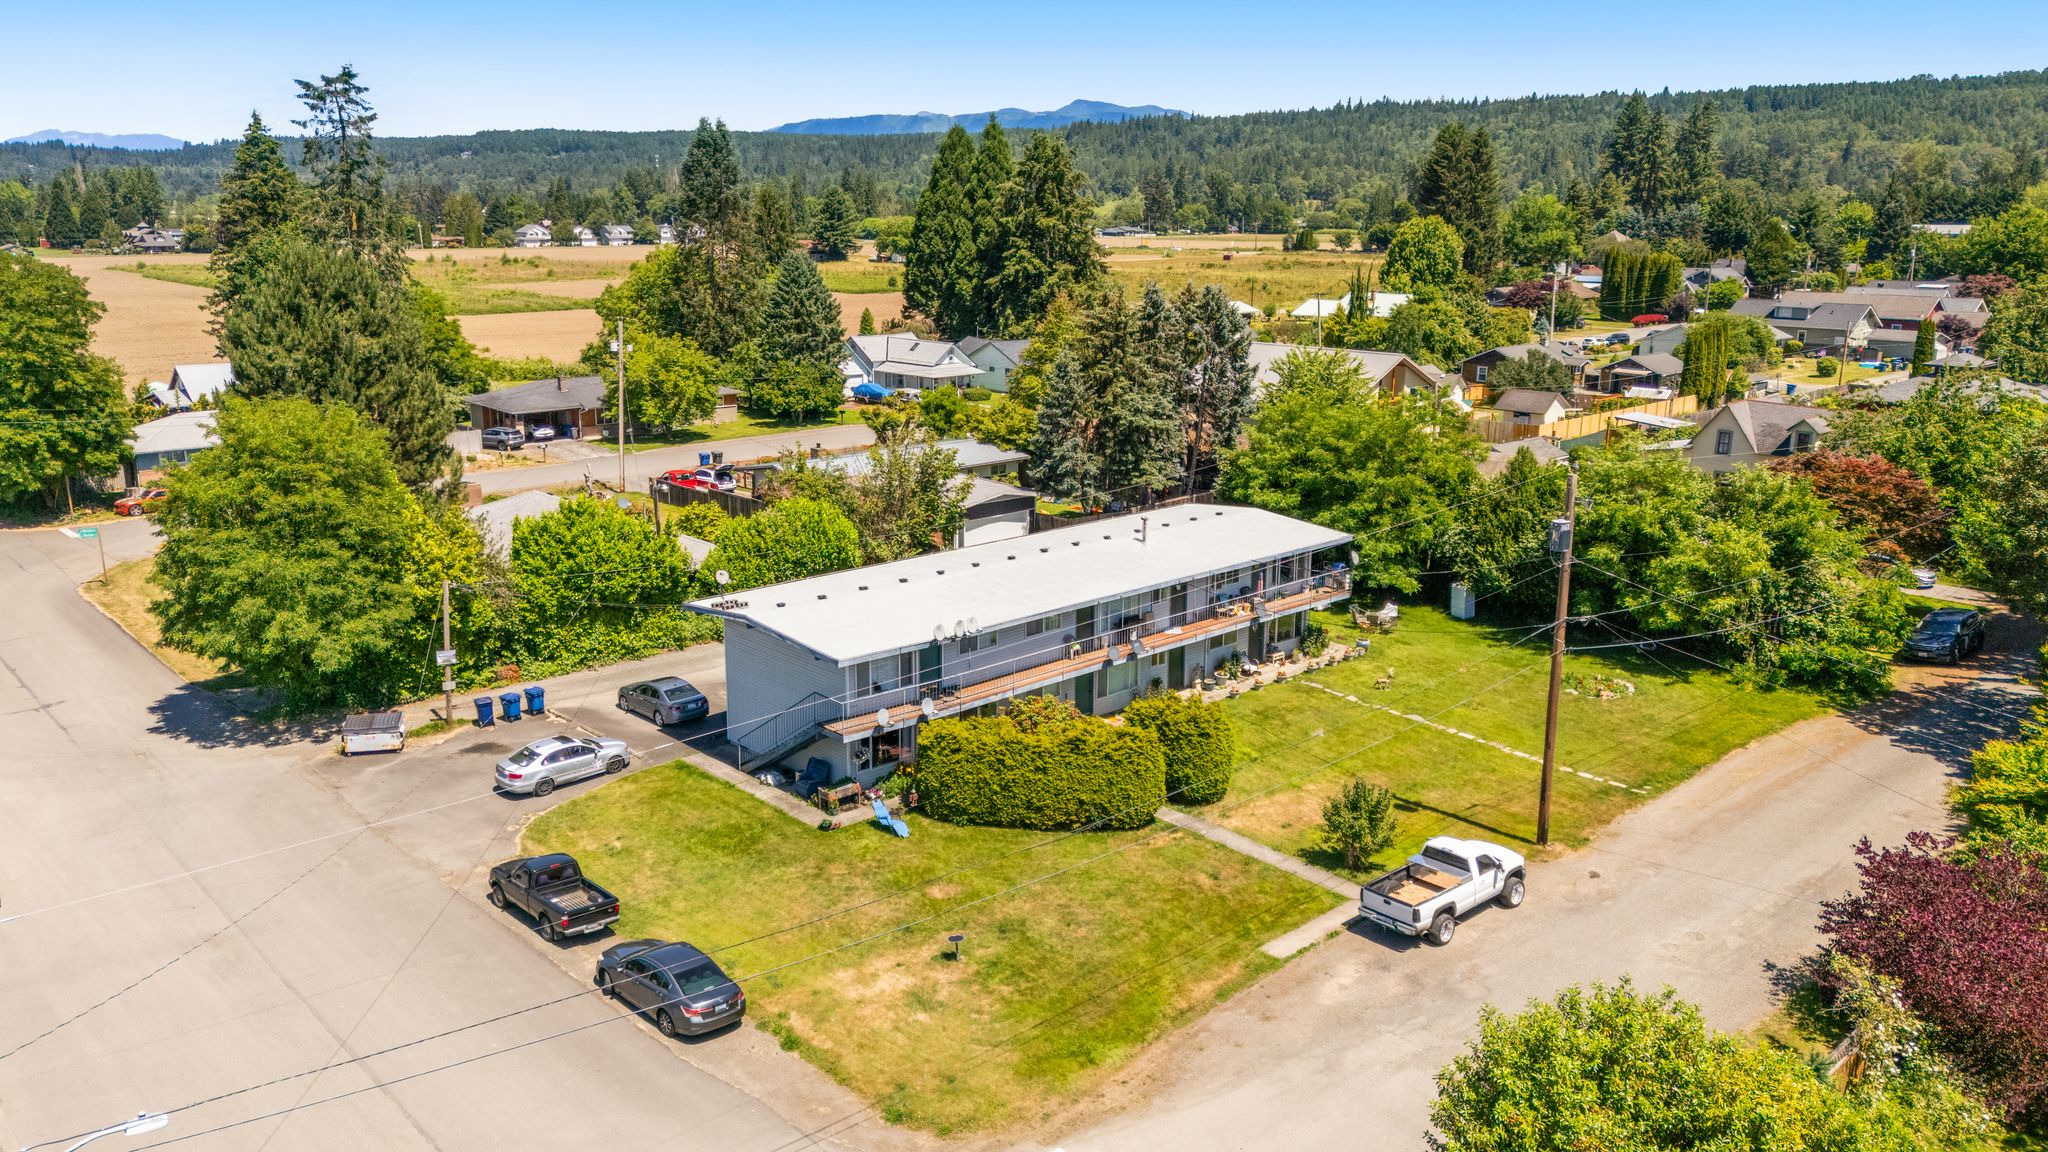
The property is situated on a corner lot with alley access and is zoned UR-2, providing additional long-term flexibility and future redevelopment potential (buyer to verify).
Whether your goal is long-term appreciation, rental income, or future development, this zoning creates options that many duplex properties simply don't offer.
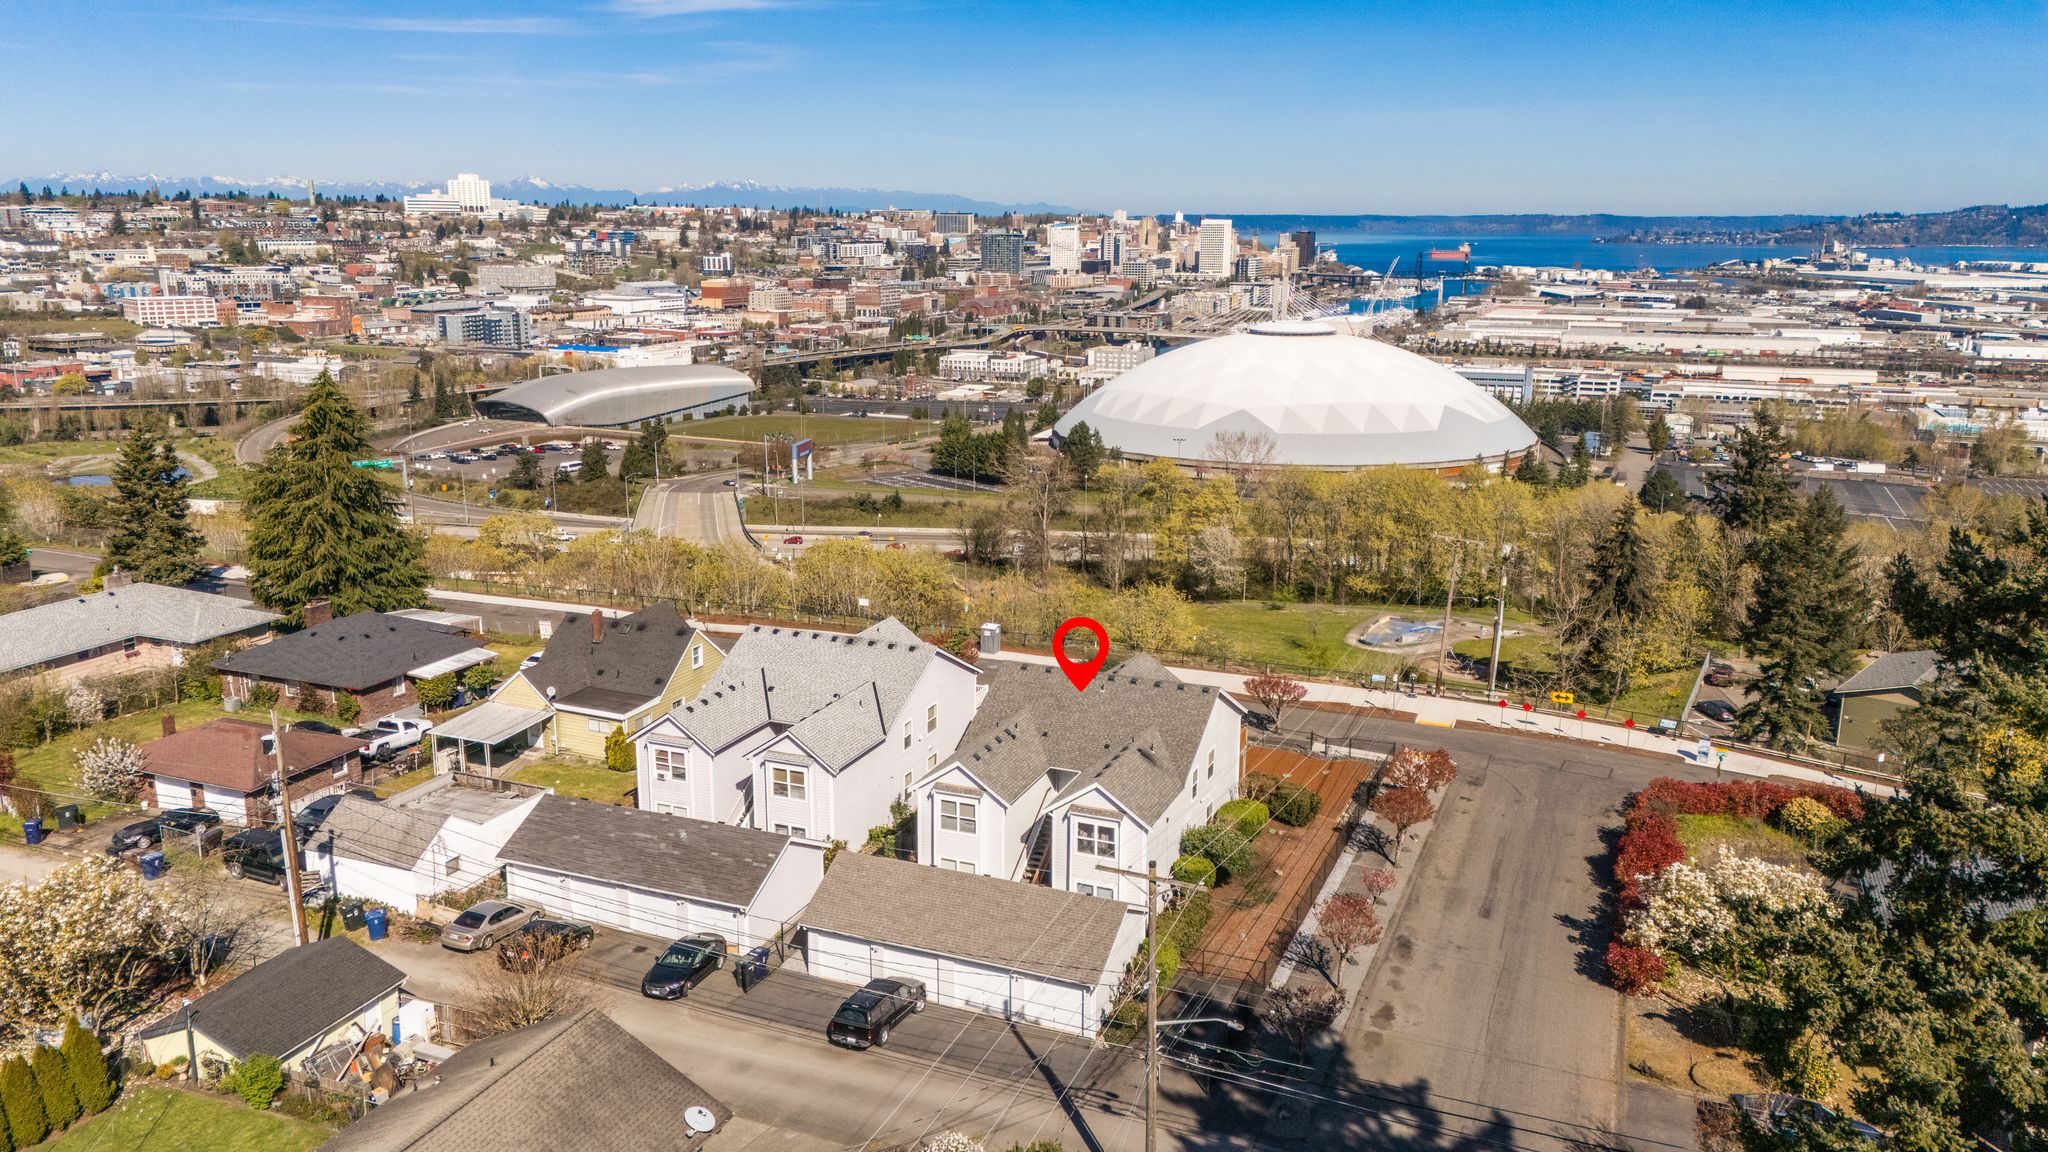
Prime Tacoma Location
Location remains one of the biggest drivers of multifamily value, and it's difficult to beat this neighborhood.
The property is conveniently located near:
- Tacoma's 6th Avenue District
- Tacoma General Hospital
- Allenmore Hospital
- University of Puget Sound
- Downtown Tacoma
- Ruston Way Waterfront
- Point Defiance Park
- Highway 16
- Interstate 5
This central location continues to attract both renters and homeowners seeking convenient access to employment, dining, recreation, and transportation.
Why This Property Stands Out
Inventory of quality duplexes in Tacoma remains limited, especially properties offering immediate occupancy, significant updates, and future development potential.
Whether you're looking to offset your mortgage by living in one unit while renting the other, or you're searching for a turnkey investment property in one of Tacoma's strongest rental markets, 2918 S 7th St deserves a closer look.
Schedule a Showing
As a multifamily specialist, I help buyers and sellers throughout Tacoma, Seattle, and the greater Puget Sound area navigate investment property opportunities.
For more information, financial projections, or to schedule a private showing, visit:
https://www.soundmultifamily.com/property/2498906/
Charles Burnett, CCIM
Founder | Sound Property Group
Tacoma & Seattle Multifamily Broker
Specializing in apartment buildings, duplexes, fourplexes, and investment property sales throughout Western Washington.